本文目标在于利用 $Python$ 快速画出符合自己要求的箱图与密度图。
矩形图
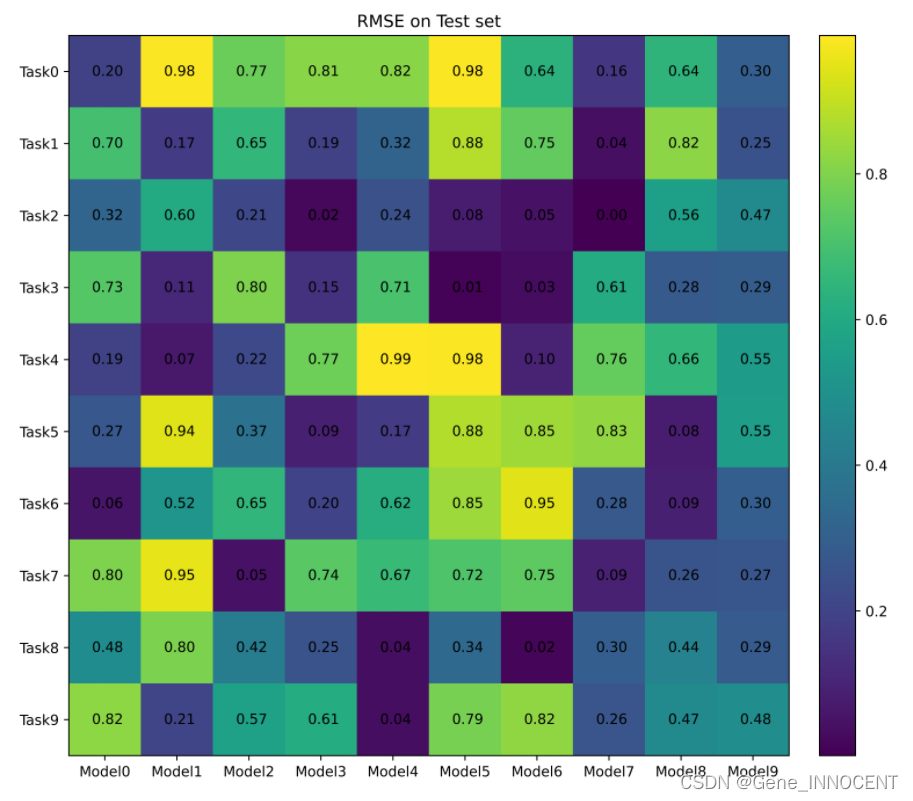
已有一个 numpy 矩阵 mat,其中 mat[i, j] 表示第 i 个模型对第 j 个任务的预测结果
1
2
3
4
5
6
7
8
9
10
11
12
13
14
15
16
17
18
19
20
21
22
23
24
25
26
27
28
29
30
31
32
33
34
35
36
37
import numpy as np
import matplotlib.pyplot as plt
import matplotlib.ticker as ticker
from mpl_toolkits.axes_grid1 import make_axes_locatable

def plot_matrix(mat):
    x_labels = [f"Model{i}" for i in range(mat.shape[1])]
    y_labels = [f"Task{i}" for i in range(mat.shape[0])]

    fig = plt.figure(figsize=(10, 9))
    plt.subplot(1, 1, 1)
    ax = plt.gca()
    im = plt.imshow(mat)

    divider = make_axes_locatable(ax)
    cax = divider.append_axes("right", size="5%", pad=0.3)
    plt.colorbar(im, cax=cax)

    for i in range(mat.shape[1]):
        for j in range(mat.shape[0]):
            ax.text(i - 0.18, j + 0.06, "{:.2f}".format(mat[j, i]))

    ax.set_xticks(range(len(x_labels)))
    ax.set_xticklabels(x_labels)

    ax.set_yticks(range(len(y_labels)))
    ax.set_yticklabels(y_labels)

	# 避免横纵坐标太密集
	# ax.xaxis.set_major_locator(ticker.MultipleLocator(base=5))
    # ax.yaxis.set_major_locator(ticker.MultipleLocator(base=5))

    ax.set_title("RMSE on Test set")
    plt.savefig(model_dir + f"res.png", dpi=700)

mat = np.random.rand(10, 10)
plot_matrix(mat)
画图结果: